
by Donny Thurston
5. Examine graphs of y = a sin(bx + c) for different values of a, b, and c.
Provide a mathematical interpretation of the Parameters a, b, and c.
Explore using animations to illustrate the impact of each parameter.
y = sin (x) represents an interesting type of function. To describe it simply, the function oscillates, repeating at a certain frequency from the domain of negative infinity to positive infinity, although constricted to a range of [-1,1].
However, like nearly any function, certain parameters can be adjusted to alter the shape and general behavior of the parent function. This write-up seeks to examine the influence that changes in a few basic parameters can have on the graph of the function, as well as to better understand how parameters may interact. In particular, we will be looking at the parameters a,b, and c in the function y = a sin(bx +c).
Before we start, we will assume that we already have an understanding of the basic mathematics behind the sine function, such as the unit circle, the values of sin(x) at x = 0, x = π, etc. In the graph below, note that there are vertical lines at π and -π to help illustrate the period of the function.

To start, let’s examine the parent function, y = sin(x), above. In this instance we would consider the parameters a and b to be 1, and for c to be 0. This is because if a or b were to be 0, then the function would essentially be y = 0, since 0*sin(x) must be 0, and sin(0x) is also 0 for all values of x.
Here we see that the function ranges from y = -1 to y = 1. This range represents the function’s amplitude. As we will use it today, the amplitude is the half of the distance between the maximum and minimum points on the range of the function. It is how far "up and down" the function ranges from the horizontal axis that it is situation upon. For instance, in the parent function, y = sin(x), the amplitude is 1, since it reaches a value of 1 and it goes down to -1, covering a distance of 2. Amplitude will be discussed further below.
Also of interest is the fact that the function repeats every so many units of x. This measure then represents the function’s period. Observe that the parent function has a period of 2π, because it is at 2π that values of sin begin to repeat themselves, as can be observed on the unit circle. Period will be discussed further below.
Parameter a
To start, let us examine how the adjusting the parameter a in the function y = a sin(x) influences the function. Some values of a:

a = 1 in blue a = 2 in purple a = 3 in red a = 4 in green a = 5 in cyan
As we can see, adjusting a changes the amplitude of the function. Note that, apparently, the period of the function is not changed.
Mathematically, this makes perfect sense. If we were to consider y = a sin(x) no different than any function of the form y = a f(x), we can see that as a changes for the same input, x, it is really the output, y, that is directly changing. In other words, a is completely independent of the rest of the function, and so is really a direct influence on y.
For y = a sin(x), a is simply a constant by which the value of sin(x) is multiplied. This results in a function that rises and falls faster and farther. If the maximum value of sin(x) is 1 (when x = π/2), then when a is 1, the maximum value of y is 1 * 1 = 1, and when a is 5, the maximum value of y is 5 * 1 = 5.
To look into this further, we can remember that the range of y = sin(x) is [1,-1], which one remembers when considering the unit circle. Therefore, the range of y = a*sin(x) would be [a,-a]. Since the amplitude of a function is half of the distance between the upper limit and the lower limit of the range, then the amplitude is (1/2)*(a-(-a)) = a. However, remember that the definition of amplitude is a distance. Since distances are always positive, it is the case that the amplitude is best said as amplitude = |a|.
So, then, what about negative values of a? Given what we have talked about, we would predict that a negative value of a would create negative values of y when sin(x) is positive, and positive values of y when sin(x) is negative. In other words, the graph would stretch in the same manner as it would if a was positive, in addition to reflecting across the x-axis. We can observe this in the following animation:
In this figure, a is ranging from 4 to -4.
Also of note is what happens when a = 0. In this case, we get the function y = 0, which is to be expected since 0*sin(x) results in 0 for any x, as previously mentioned.
So then, how does a influence the amplitude? Since we consider amplitude to be the maximum value of y of a sine function, we learn thatAmplitude = |a|
In addition, negative values of a reflect the function across the x-axis.
We also see that a has no influence on the period of the function, neither does it shift the function in any direction.
Parameter b
So then, how does b influence the function y = sin(b*x)? Let us examine some values of b.


Blue is in y = sin(x) Purple is y = sin(2x) Red is y = sin(3x)
As we see here, the value of b influences the apparent frequency of the function, without adjusting the amplitude. Or, another way of looking at this is that b changes inversely with the period of the function. For the function y = sin(x), the period is 2π. For y = sin(2x), the period is just π, and for y = sin(3x), the period is 2π/3. It would appear that the period of the function is equivalent to 2π/b.
Mathematically, this is supported by considering the period of sin(x). The period is 2π because that is the value it takes to complete one cycle is from 0 to 2π, or 0 ≤ x ≤ 2π. If we are presented with the function y = sin(bx), then bx will complete one cycle from 0 ≤ bx ≤ 2π. Solving for x, we get 0 ≤ x ≤ 2π/b, or the fact that it takes 2π/b to complete one cycle. This would also confirm that larger values of b decrease the size of the period, while smaller values of b increase the size of the period.
So does this hold up for all values of b? See the animation below:
As we can see, it does. For values of b less than 1, the period becomes bigger, consistent with our calculation. So what about when b is negative? It appears that the graph is reflected across the x-axis when this is done, just as when a is negative. Is this what is happening?
In fact, it can be considered that way. y = sin(x) is an odd function, meaning that f(-x)=-f(x). For example, assume that:f(x) = 2sin(x) and -f(x) = -2sin(x), then
f(-x) = 2sin(-x)
f(-x) = -2sin(x)
f(-x) = -f(x)
In other words, a negative b is equivalent to a negative a, and so the effects are the same.
Parameter c
So, how does c influence the function y = sin(x+c)? Let’s observe.
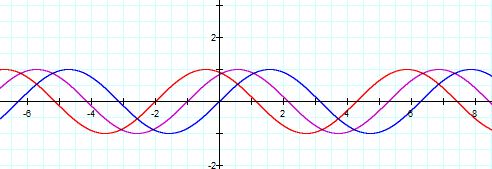
y = sin(x) in blue y = sin(x + 1) in purple y = sin(x + 2) in red
It appears that the function shifted to the left c units. The negative characteristic of the shift is consistent with other functions who have a similar parameter (i.e. y = (x+1)^2 is shifted one unit to the left of y = x^2). In fact, one may be tempted to determine that this is exactly what happened. So, we would predict that the phase shift of the function y = a sin(bx + c) would be –c.
So let’s examine the function y = sin(2x + 1). We would expect this function to be equivalent to y = sin(2x), but shifted to the left one unit.

y = sin (2x) in red y = sin (2x + 1) in blue
While it may look correct at first, when we look closely, we actually see that the phase shift was only ½ of a unit! Therefore, the phase shift must be more complex than that.The phase shift is actually dependent on two parameters, b and c.
Let’s go back to the fact that y = sin (x) cycles on 0 ≤ x ≤ 2π. Therefore, y = sin (bx + c) cycles on 0 ≤ bx + c ≤ 2π. Solving for x gives us –c/b ≤ x ≤ 2π/b – c/b. Here we see the familiar 2π/b for the period! We also see that –c/b represents a shift in that cycle, and that it does not actually enlarge or shrink the cycle.Therefore, we see that c is an important parameter, but it does not act on its own. It, in conjunction with b, creates a shift in the function.
Let’s see this happen on a function. Here are four functions, Red is y = sin(x), blue is y = sin(x+c), cyan is y = sin (2x), and green is y = sin(2x+c). c, in both instances, ranges from 4 to -4.
As we can see, even though c ranges between the same two numbers in the functions, they do not shift the same amount of distance. Instead they shift an equivalent proportion of the period of the function.
Putting all of this together, and what do we get? A picture of what the parameters in a sine function mean.
Let’s predict y = 3 sin (2x-4). Well, a suggests that the amplitude will be 3. b suggests that the period will be π, and c and b together suggest that the phase shift will be 2 to the right.
And look here:
